AI agents are increasingly deployed in production environments, handling complex workflows that involve chaining large language model (LLM) calls, invoking external tools, managing memory states, and coordinating multi-agent systems. However, the lack of robust observability mechanisms often leaves engineers blind to critical failures, making debugging a daunting task. This article explores engineering strategies to implement observability, tracing, and monitoring for AI agent pipelines, ensuring transparency and reliability in production systems.
Why Traditional Monitoring Falls Short
Traditional application performance monitoring (APM) tools like Datadog, Grafana, and CloudWatch excel at tracking infrastructure metrics such as latency, error rates, and throughput. However, these tools fail to capture the semantic state of AI agents-the reasoning, decision-making, and contextual information that underpin their behavior. For example, they cannot identify which LLM call introduced a hallucination, why a tool was invoked, or how a memory state influenced a decision. AI agents require observability frameworks that go beyond system state to capture cognitive processes.
The Four Pillars of AI Agent Observability
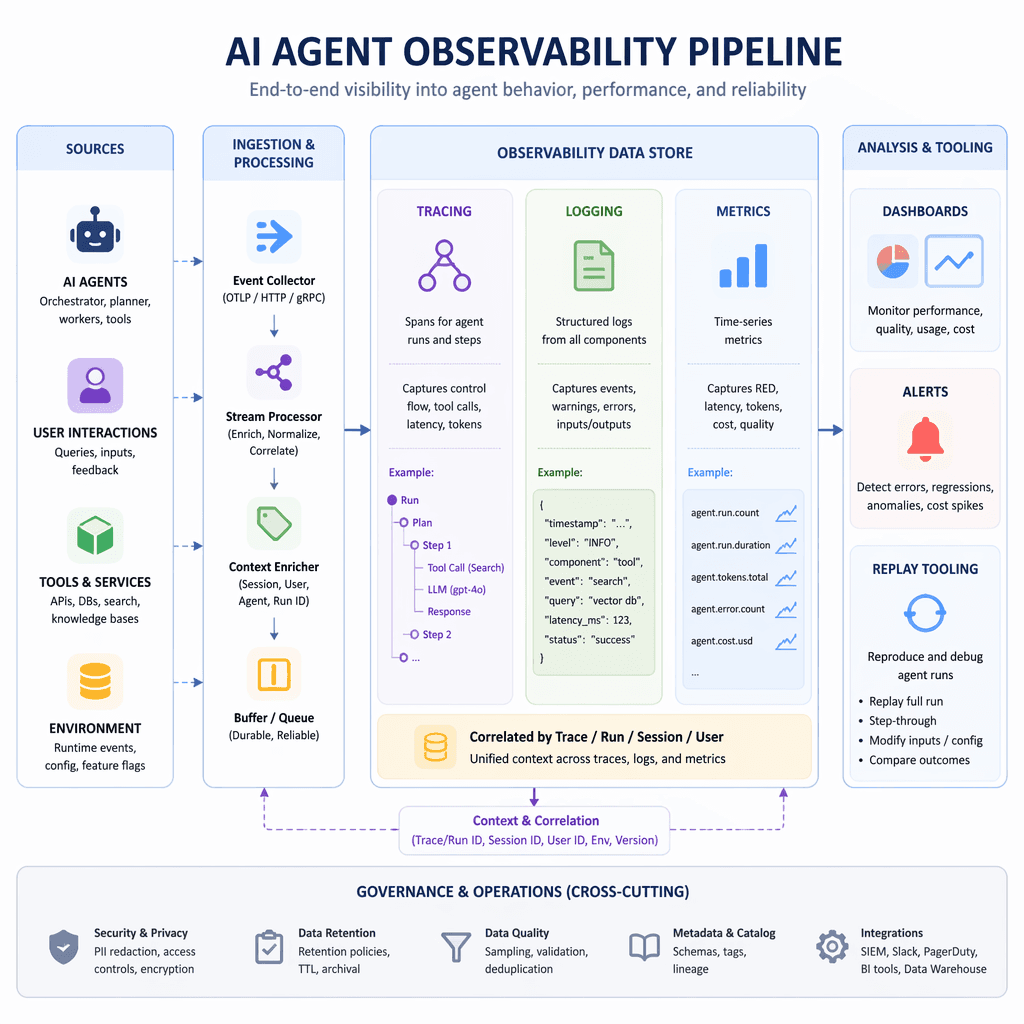
Effective observability in AI agent pipelines is built on four key pillars: distributed tracing, semantic logging, real-time metrics, and replay tooling. Each pillar addresses specific challenges in understanding and debugging agent behavior.
1. Distributed Tracing Across the Reasoning Chain
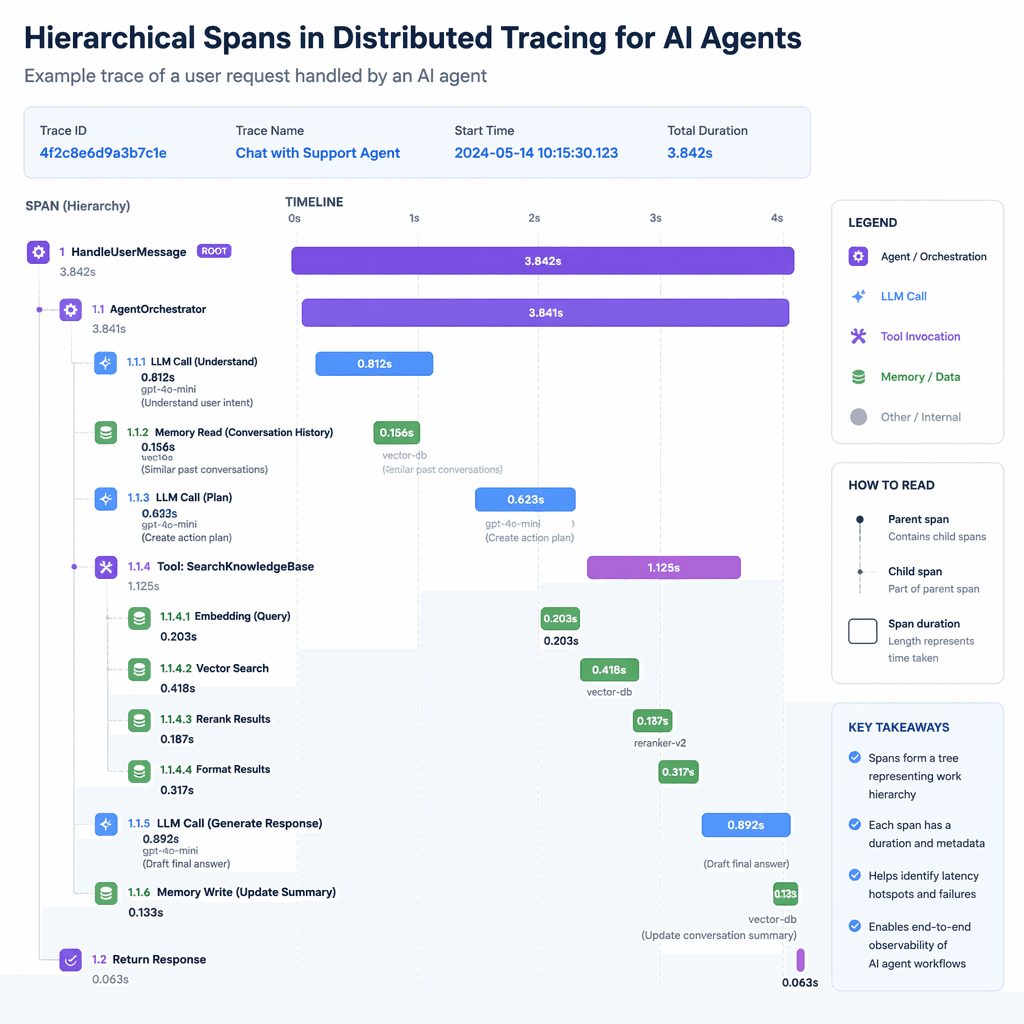
Distributed tracing provides a hierarchical record of every step an agent takes to produce its output, akin to a call stack for cognition. A well-structured trace includes span hierarchies, inputs and outputs at each node, latency metrics, token counts, and decision rationales. In multi-agent systems, trace contexts must propagate across agents to reconstruct the full causal chain. OpenTelemetry is a popular choice for instrumentation, but it must be implemented at the orchestration layer for end-to-end visibility.
2. Semantic Logging with Metadata
Logging raw text inputs and outputs is insufficient for debugging. Semantic logging attaches metadata such as prompt template IDs, user session IDs, retrieval context, tool call graphs, and quality signals. Structured logging formats like JSON enable queryable and aggregatable records, making it easier to pinpoint failures and analyze trends.
3. Real-Time Metrics and Alerting
Metrics provide proactive insights into system health. Reliability metrics like task completion rates and tool failure rates, performance metrics like end-to-end latency and token consumption, and quality metrics like answer relevance scores are critical for monitoring AI agent pipelines. Alerts should be configured based on use-case-specific thresholds to catch issues early.
4. Replay and Debugging Tooling
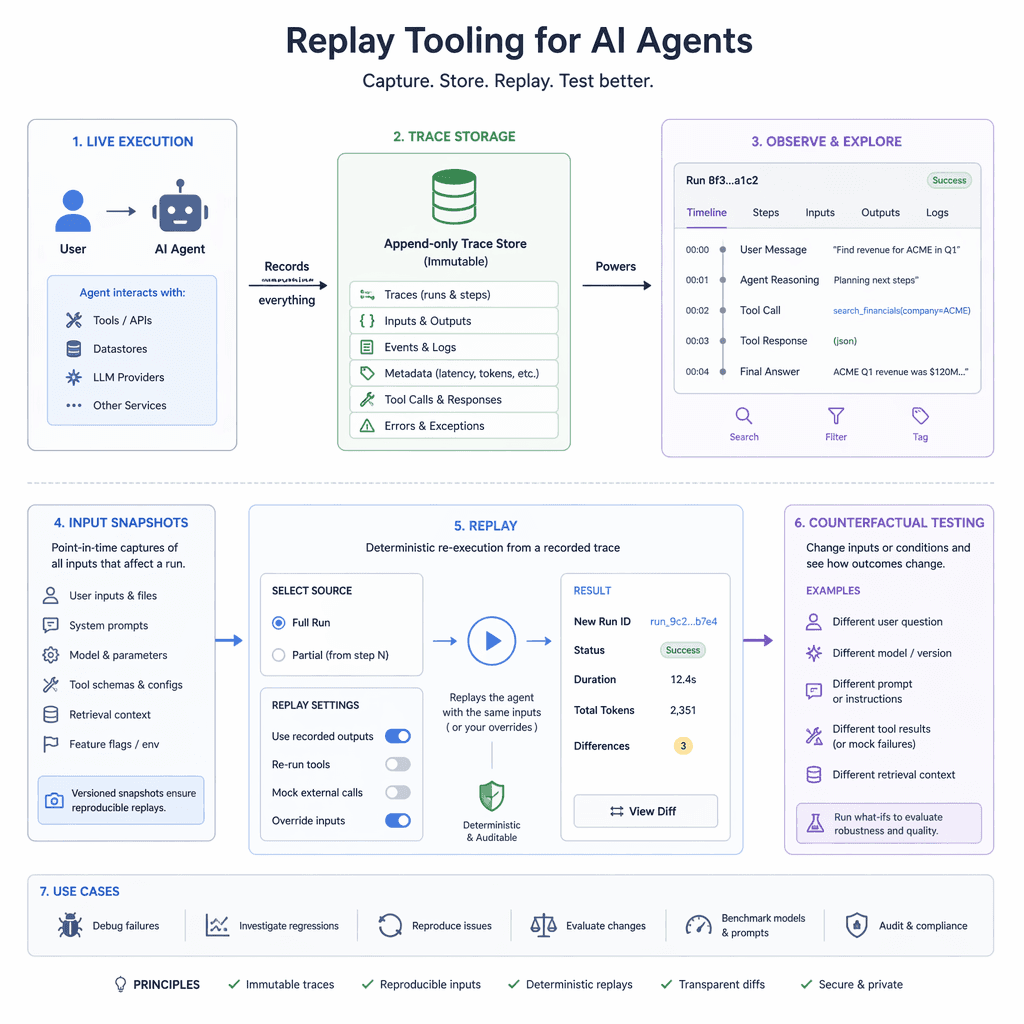
Replay tooling allows engineers to reproduce production failures in controlled environments by capturing immutable traces, input/output snapshots, and counterfactual scenarios. This enables iterative debugging and regression test generation, turning production incidents into valuable test cases for continuous improvement.
Observability in Multi-Agent Systems
Multi-agent systems introduce additional complexity, requiring coordination layers to manage trace propagation, shared memory states, and inter-agent communication. Observability frameworks must account for these dynamics to provide holistic visibility into system behavior.
Key Takeaways
- Traditional monitoring tools fail to capture the semantic state of AI agents.
- Distributed tracing is essential for reconstructing reasoning chains.
- Semantic logging with structured metadata improves debugging efficiency.
- Real-time metrics enable proactive monitoring and alerting.
- Replay tooling turns production failures into actionable test cases.
"You can't fix what you can't see. Observability is the cornerstone of reliable AI agent systems."
Builder note
Instrumenting observability at the orchestration layer ensures end-to-end visibility without manual intervention at every agent boundary.
Source Card
Inside the Black Box: Observability and Tracing for AI Agent PipelinesThis source provides foundational insights into observability challenges and solutions for AI agent pipelines.
Mindra Blog
| Signal | Why it matters |
|---|---|
| Span hierarchy | Helps reconstruct reasoning chains for debugging. |
| Semantic metadata | Improves traceability and failure analysis. |
| Latency metrics | Identifies bottlenecks in the pipeline. |
| Replay tooling | Enables iterative debugging and regression testing. |
- Implement distributed tracing using OpenTelemetry.
- Adopt structured logging formats like JSON.
- Define metrics for reliability, performance, and quality.
- Set up alerts based on use-case-specific thresholds.
- Develop replay tooling for debugging and testing.
- Distributed tracing captures reasoning chains.
- Semantic logging adds metadata for better traceability.
- Metrics provide proactive insights into system health.
- Replay tooling enables iterative debugging and testing.
- https://mindra.co/blog/ai-agent-observability-tracing-monitoring-production
Builder implications
For teams evaluating Building Transparent AI Agents: Observability and Tracing for Production Pipelines, the useful question is not whether the announcement sounds important. The useful question is whether it changes how an agent system is built, tested, operated, or bought. The source from mindra.co gives builders a concrete signal to inspect: Inside the Black Box: Observability and Tracing for AI Agent Pipelines .... That signal should be mapped against the parts of an agent stack that usually become fragile first, including tool contracts, long-running state, evaluation coverage, cost visibility, failure recovery, and the handoff between prototype code and production operations.
Production lens
Treat this as a systems decision, not a headline decision. A builder should ask how the change affects the agent loop, what needs to be measured, which failure modes become easier to catch, and whether the team can explain the behavior to a customer or operator when something goes wrong. If the answer is vague, the technology may still be useful, but it is not yet a production advantage.
Adoption checklist
- Identify the workflow where AI observability, distributed tracing, semantic logging, multi-agent systems already creates measurable pain, such as slow triage, brittle handoffs, unclear ownership, or poor observability.
- Write down the current baseline before changing the stack: latency, cost per run, recovery rate, review time, and the percentage of tasks that need human correction.
- Prototype against a real internal workflow instead of a demo task. The workflow should include imperfect inputs, missing context, tool failures, and at least one approval step.
- Add traces, event logs, and evaluation checkpoints before expanding usage. A new framework or model is hard to judge when the team cannot see where the agent made its decision.
- Keep rollback boring. The first version should let an operator pause automation, inspect the last decision, and return control to a human without losing state.
- Review the source again after testing. The source-backed claim should line up with observed behavior in your own environment, not just with launch copy or release notes.
| Area | Question | Practical test |
|---|---|---|
| Reliability | Does the agent fail in a way operators can understand? | Run the same task with missing data, stale data, and a tool timeout. |
| Observability | Can the team reconstruct why a decision happened? | Inspect traces for inputs, tool calls, model outputs, approvals, and final state. |
| Cost | Does value scale faster than usage cost? | Compare cost per successful task against the old human or scripted workflow. |
| Governance | Can sensitive actions be reviewed or blocked? | Require approval on high-impact actions and log who approved the step. |
What to watch next
The next signal to watch is whether builders start publishing implementation notes, migration stories, benchmarks, or reliability reports around this source. That secondary evidence matters because agent infrastructure often looks clean at release time and only shows its real shape once teams connect it to messy business workflows. Strong follow-on evidence would include reproducible examples, clear limits, documented failure recovery, and customer stories that describe what changed in the operating model.
Key Takeaways
- Do not treat a release as automatically production-ready because it comes from a strong source.
- Use the source as a reason to test a specific workflow, not as a reason to rewrite the entire stack.
- The best early signal is not novelty. It is whether the system becomes easier to observe, recover, and improve.